Build your dashboard
The dashboard is a grid of tiles you arrange yourself. Nothing about it depends on your plan.
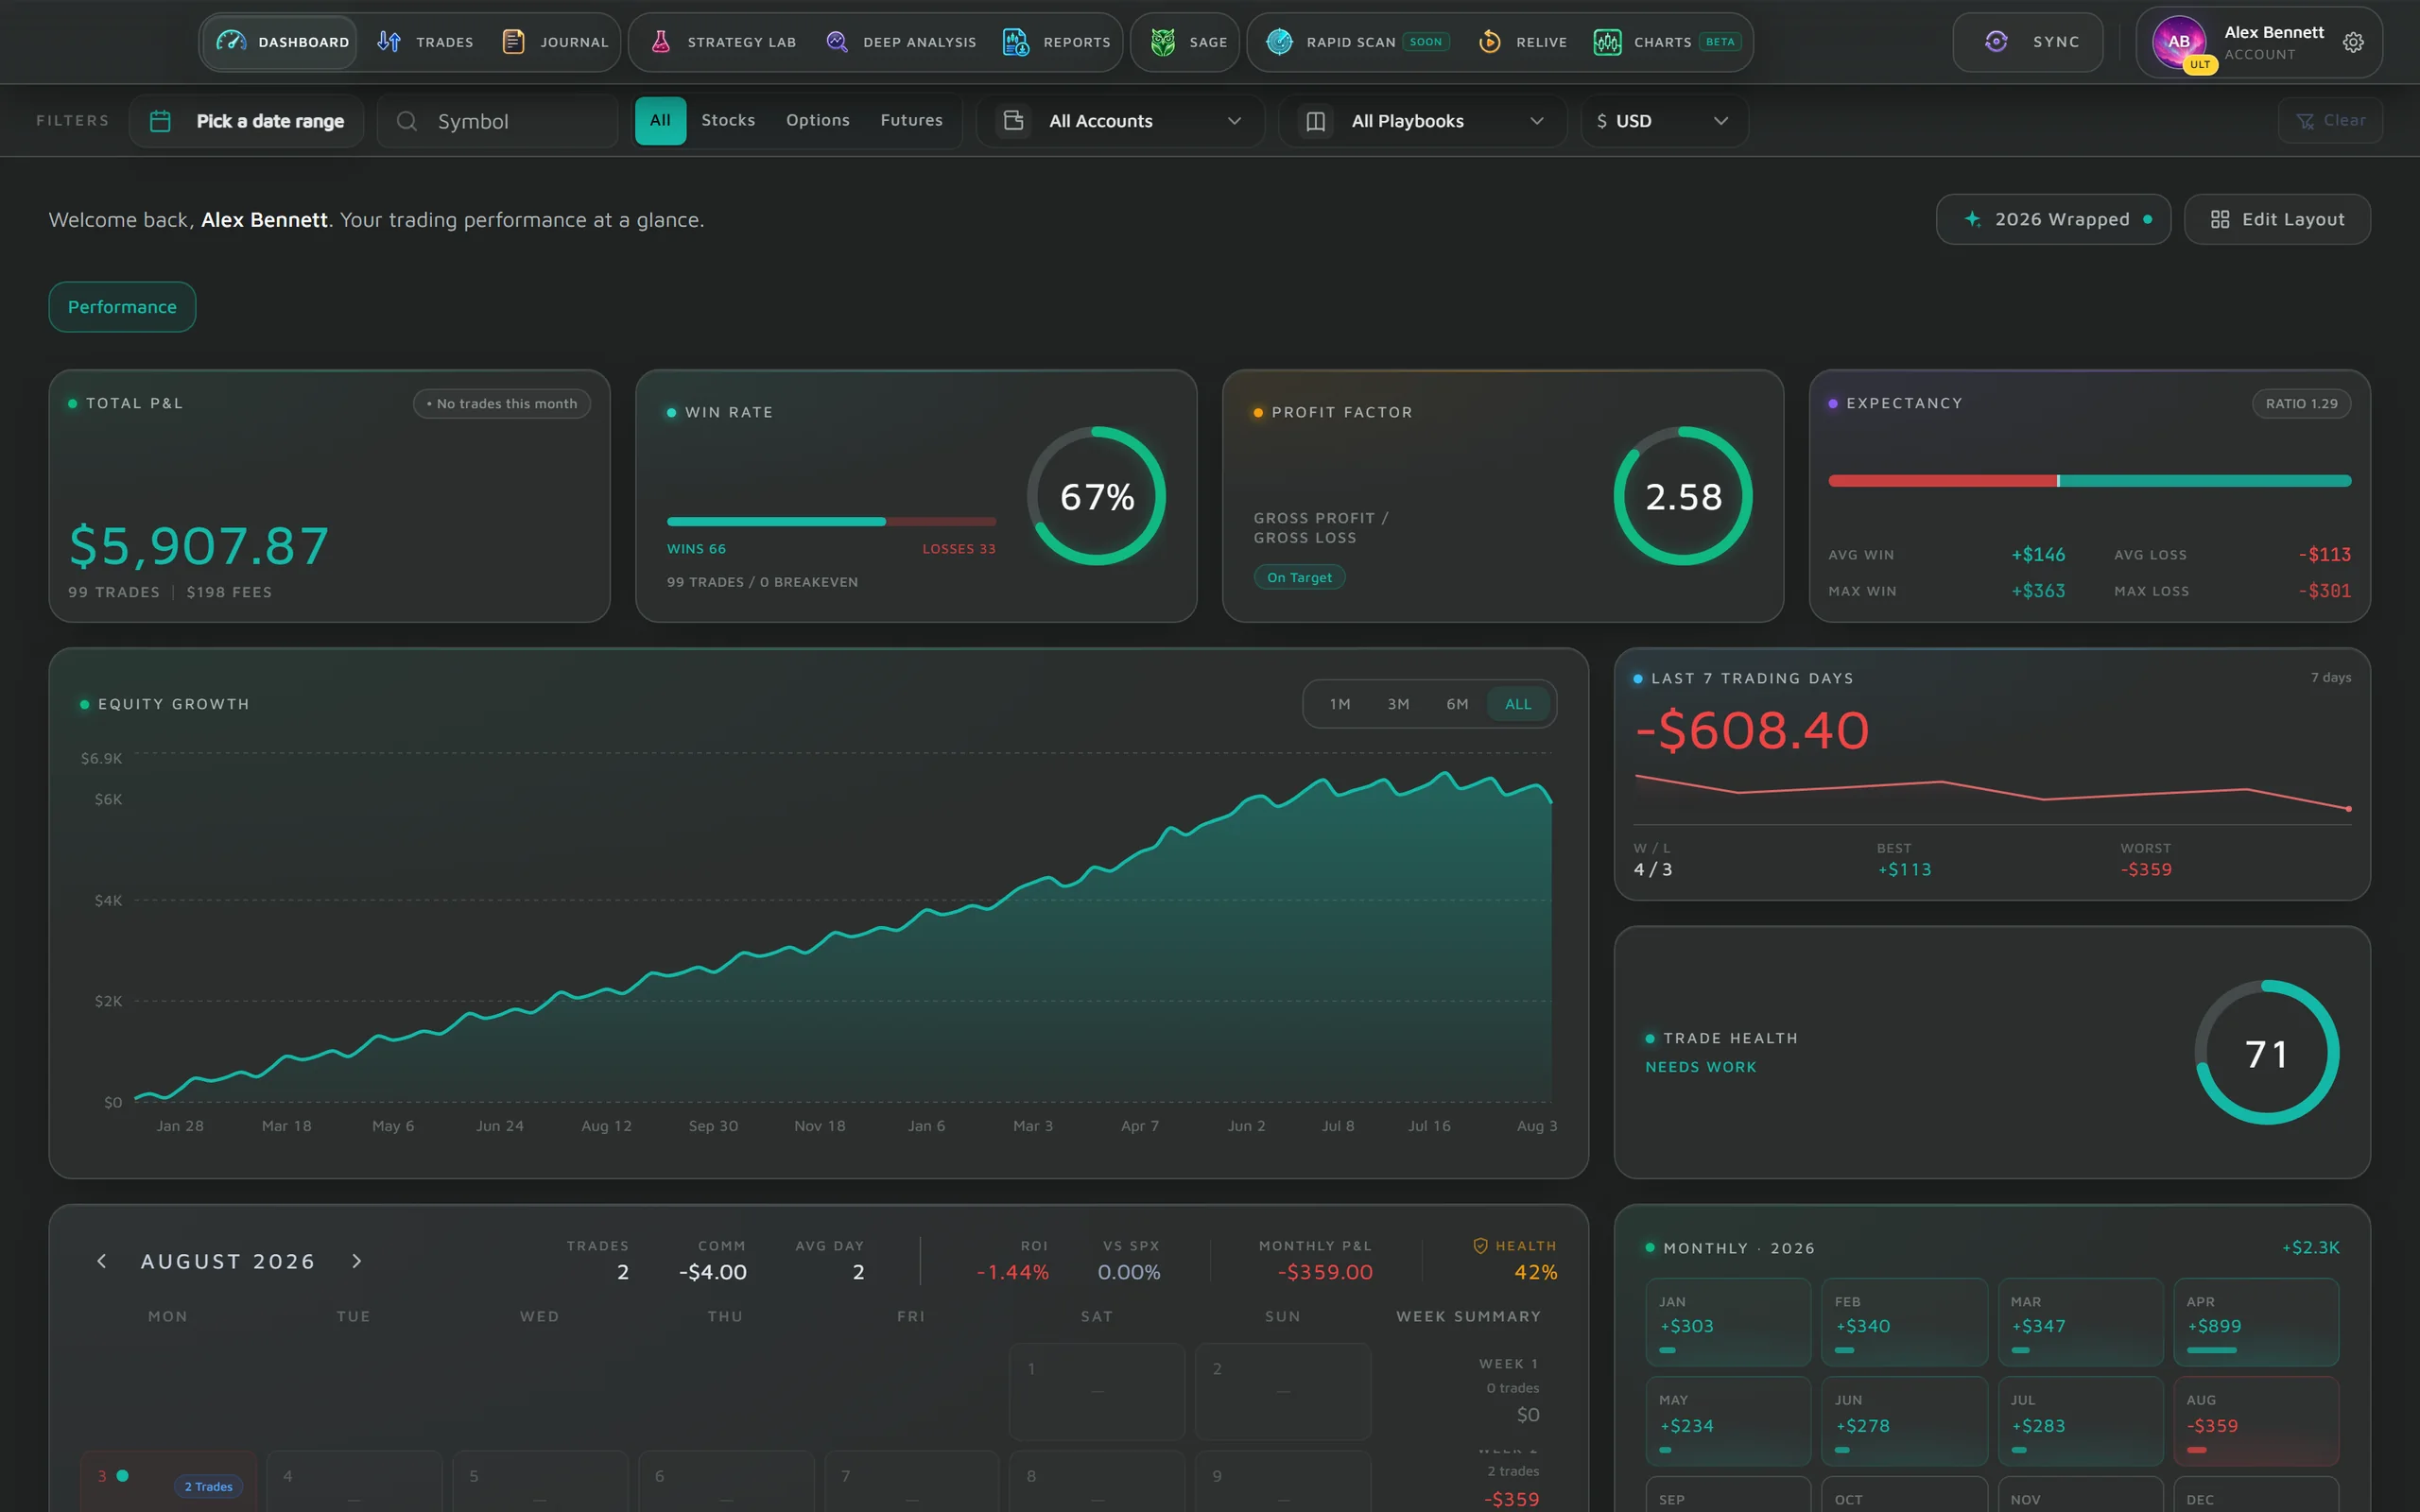
- 01Start from a view. The Arrangement bar offers 3 starting points: Command Center (current performance, recent activity, market context, and review history in one view), Review & Discipline (puts trade health and review context first) and Performance Trends (emphasises equity, monthly results, and longer-running performance trends). Pick one and the tiles spring into that layout.
- 02Edit Layout turns editing on: drag a tile to reorder it, resize it from a corner, and the Arrangement reads Custom once you have moved anything.
- 03Add widgets opens the catalogue, shared by every dashboard you save. Switch a widget on or off and it joins or leaves every view.
- 04Save Layout keeps the arrangement on your account, so it follows you to any browser; Discard drops the edits since the last save.
- 05New view on the tab strip adds another dashboard, up to 5. Each keeps its own arrangement; the widget catalogue is shared.
The catalogue holds 13 widgets: Total P&L, Win Rate, Profit Factor, Expectancy, Weekly P&L, Trade Health, Equity Curve, Sage Insight, Market Overview, Recent Activity, Performance Calendar, Yearly History and Monthly Breakdown.
A dash is not a zero
A figure with no answer renders as a dash, never as a number. Profit factor is gross wins divided by gross losses, so an account with no losing trade has no ratio and its ring says No losing trades yet. Expectancy is the average result per closed trade.
Reports
Reports in the top bar answers one question at a time over your closed round trips. The scope bar sets the dates (closing dates, in UTC), the account, symbol, asset class, setup, tags, direction and outcome, and whether figures are net of fees or gross.
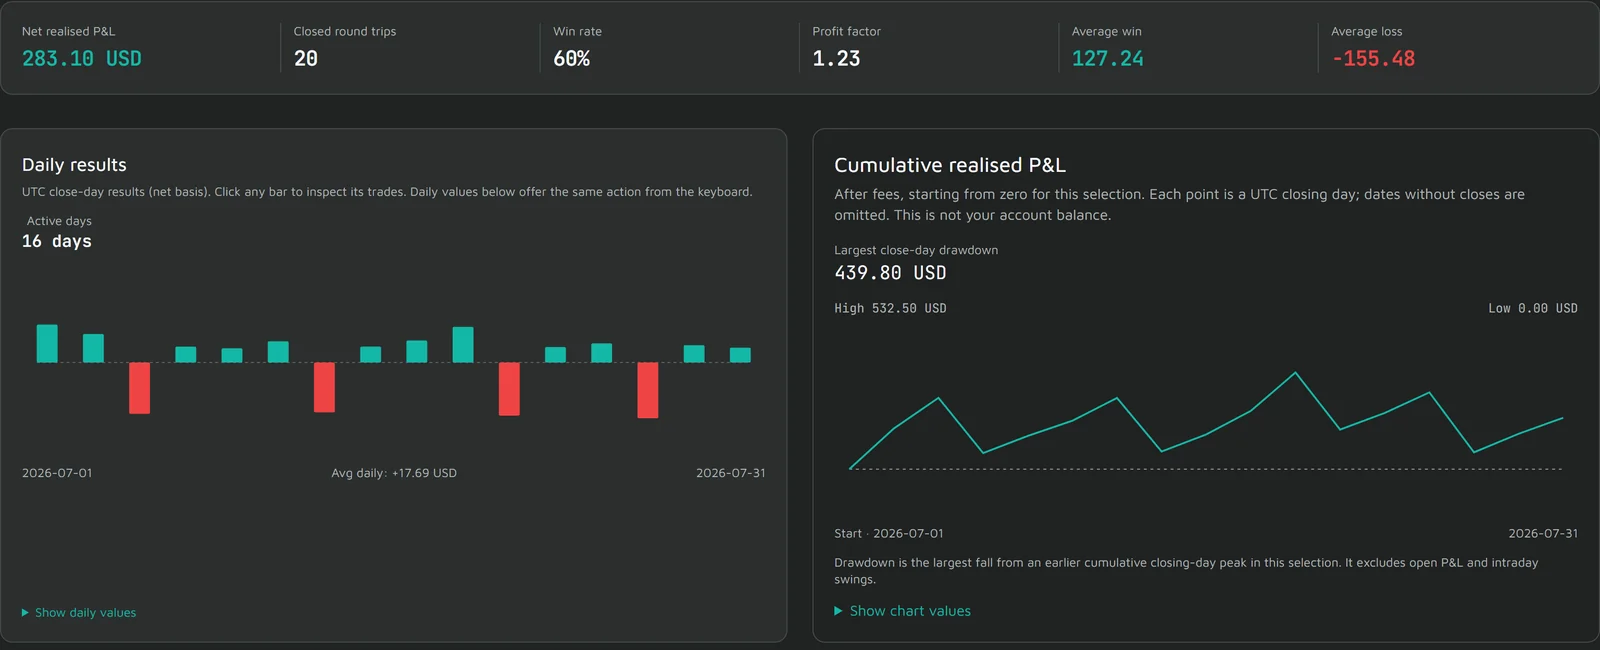
- Overview: How am I performing overall? High-level performance summary, descriptive statistics, daily results, and cumulative curve.
- Breakdowns: Where is my performance concentrated? Detailed performance grouped across time, instruments, setups, and outcomes.
- Compare: How do two timeframes or groups compare? Side-by-side comparison of two cohorts or periods.
- Saved views: Which reports do I track regularly? Quick access to your saved queries and views.
Breakdowns group the same trades by daily results, monthly results, day of week, entry time, minutes after the open, holding time, symbols, asset class, setups, tags, tag categories, long vs short or winners vs losers, and show each group's trades, realised P&L, win rate and profit factor. Tags overlap, so a trade with two tags appears in both groups and once in the total.
Save a scope you come back to as a saved view; a rolling view always covers the last thirty days.
Year in Review
Year in Review plays your trading year back as a story, built only from your own records: closed round trips and net P&L, a day-by-day cumulative timeline with milestones, top tickers, weekday and entry-hour rhythm on your clock, hold style, streaks, playbooks and tags, your journaling habit, the mindset and energy you logged, review progress, ReLive sessions, and an archetype awarded by fixed rules that states the figures it was awarded on.
- Open it from the dashboard, the journal or Reports. Through January it opens on the year that just ended, then on the current year to date.
- The last card saves as an image sized for stories, with a switch to hide the amounts first.
- A year with no losing trade has no profit factor, so that figure shows a dash.
- The archetype is a label from rules, not a personality assessment, and nothing here infers your mood.
For the trades behind any figure, open the trade list with the same filters, or the five lenses of Deep Analysis.