Context
Leaf Charts
One chart engine across the whole workflow.
Leaf Charts is a custom-built charting engine rendered everywhere you review: dashboard summaries, trade detail and the daily review. Your executions are marked on the chart, in context, automatically. The fullscreen Charts workspace is available in beta with licensed T+1 US-equity history, and ReLive replays finished sessions on the same data; Rapid Scan is still coming soon.
Leaf Charts / Film excerptPlay to explore
01
Execution markers built in
Entries and exits render on the chart automatically — every review starts with what you did, where you did it.
02
Studies where they help
ORB levels, moving-average analysis, and session context on the charts you review with.
03
Everywhere you review
The same engine renders the dashboard, trade detail and the daily review — one visual language across your own trades.
One engine, everywhere you look
- 01
Built here, not embedded
Leaf Charts is our own canvas engine rather than a third-party widget, which is why your executions, playbook levels and replay state can be drawn as first-class parts of the chart.
- 02
The same chart in every view
The dashboard chart, trade detail, daily review and fullscreen beta workspace all render through it — one visual language instead of five. ReLive replays on the same engine; Rapid Scan stays gated until its market-data feed is licensed.
- 03
Studies where they help
Fourteen studies across trend, momentum, volatility and volume, plus overlays that only make sense here — like your hold-time band and the move you missed.
The workspace
A full charting surface, in beta
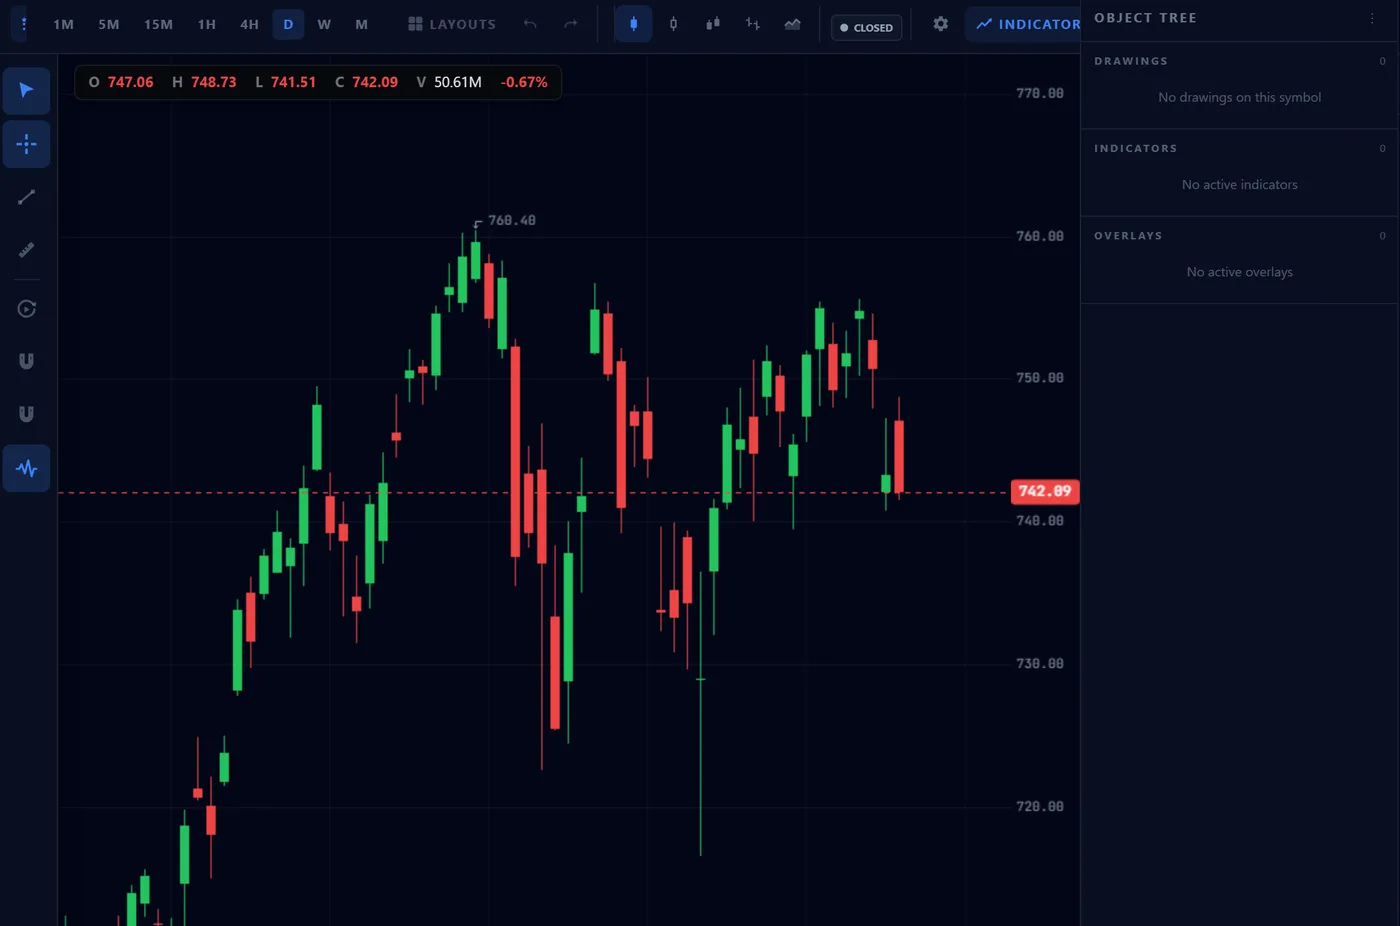
Timeframes from one minute to monthly, five chart types, chart tabs, saved layouts, undo and redo, an object tree for what is on the chart, and a watchlist beside it. Keyboard shortcuts cover search, navigation and timeframe switching. The workspace is available in beta with licensed, delayed T+1 history for US equities; it does not provide live market data.
- One minute through monthly, as candles, hollow candles, Heikin-Ashi, OHLC bars or area
- Saved layouts and an object tree for drawings, indicators and overlays
- Drawings are stored per symbol against your account, so a marked-up chart stays marked up
Tools
Mark it up, measure it, split the screen
The beta workspace carries the drawing and measuring tools a review needs, and lets you set charts side by side. Every drawing lands in the object tree, and undo and redo cover your mark-up.
- Fibonacci retracement, anchored VWAP and a fixed-range volume profile
- Long and short position tools, a measure tool, trend lines, rays, channels, rectangles, text and callouts
- Chart tabs, split layouts of up to four charts with symbol, interval and crosshair sync, and symbol search on Ctrl+K
Indicators
The studies you expect
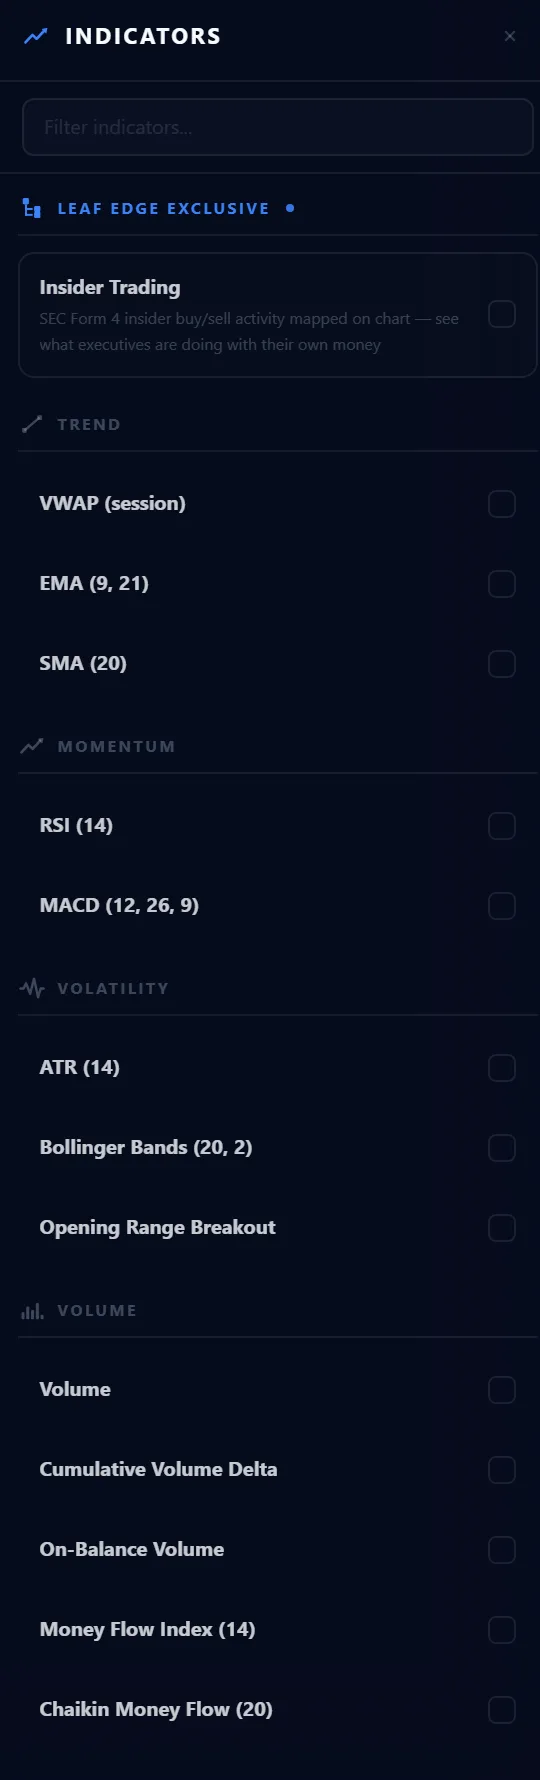
Fourteen studies across trend, momentum, volatility and volume — VWAP, moving averages, RSI, MACD, ATR, Bollinger Bands, opening-range breakout, a visible range volume profile, and volume work including cumulative delta and money flow. An insider-activity study is built too, but its provider route remains gated and is not available in the production beta.
- Fourteen studies across trend, momentum, volatility and volume
- Opening Range Breakout as a first-class study, not a workaround
- The insider-activity study remains unavailable while its provider route is gated
Context
Your symbols, side by side
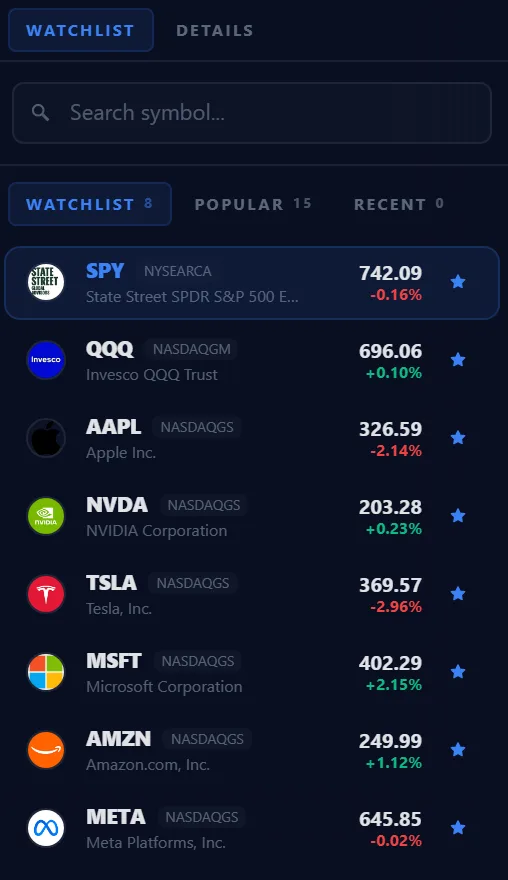
A watchlist sits alongside the chart, so switching between the symbols you follow does not mean typing a ticker each time. The workspace is available in beta with delayed T+1 US-equity charts; live quote updates remain unavailable.
Plan availability
Free, Pro and Ultimate
Available on every plan, including Free. Charts drawn on your own executions are on every plan. The fullscreen beta workspace uses delayed T+1 US-equity history.
Compare plans