Scan
Rapid Scan
Coming soon — a session-close scan with each setup's track record.
Rapid Scan is a keyboard-driven scanner for US equities that works on the last closed session. Pick chart patterns, market heat or one of your own playbooks, read each candidate on its chart, and see how that setup has followed through before: its five-session hit rate, the number of signals behind it and a 95% confidence interval. Rapid Scan is not available yet: it runs on third-party market data and stays behind a coming-soon gate until that feed is licensed. The screens below come from a pre-release build.
Rapid Scan / Product viewPlay to explore
01
Scan by setup, not symbol
Chart patterns, market heat and your own playbooks — run one and read the results as charts, not rows.
02
A track record, not a score
Each setup shows how often its past signals moved its way over the next five sessions, with the sample size and a 95% interval beside it.
03
Built for speed
Keyboard-first navigation moves you through candidates quickly, with the chart and diagnostics in one view.
From a blank screen to a shortlist
- 01
Start from what you trade
Arm one of your own playbooks and it configures the scan for you, or pick a family directly: chart patterns, market heat, or a list of your own symbols.
- 02
Scan the last close
The board is built from the most recent closed session, not the tape as it moves, so every candidate is read on a finished daily bar. Sector heat at the session close shows where something actually moved.
- 03
Read the candidates on the chart
Results arrive as a keyboard-navigable board. Each one names the pattern it matched and the levels behind it, with that setup's track record beside it — so you judge the setup rather than trusting a score.
Where to look
Scan where the market moved
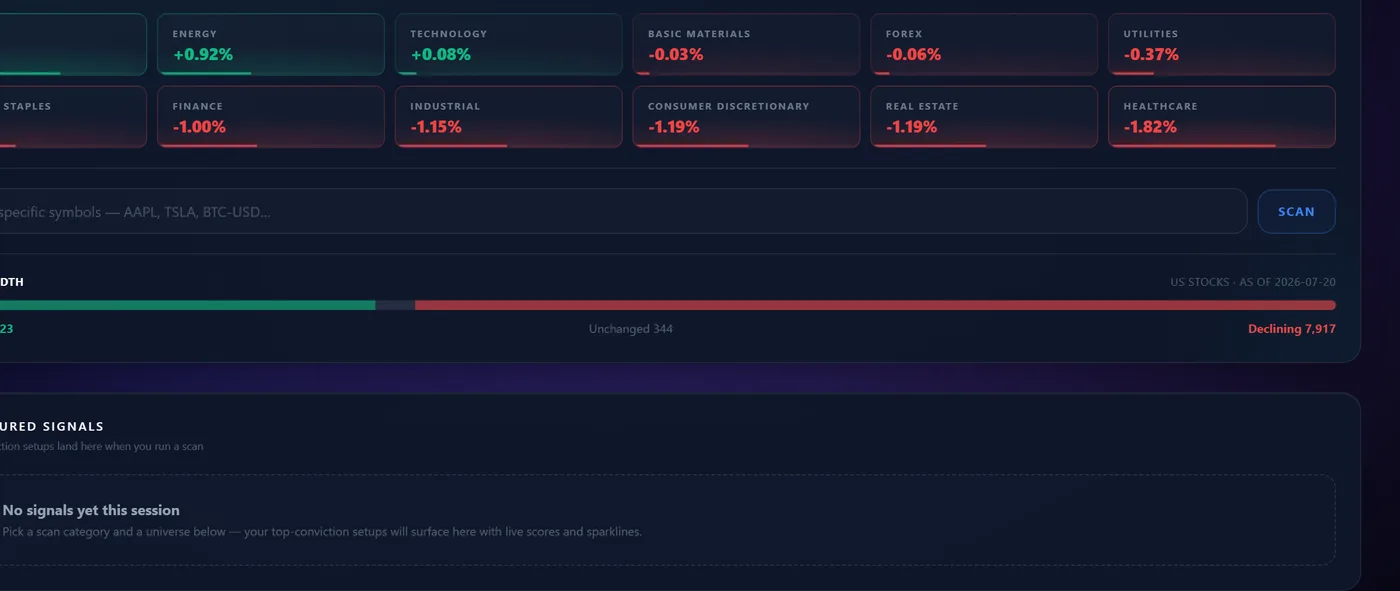
Before a scan runs you pick a universe. Sector tiles show how each benchmark closed, so a decision about where to hunt is informed rather than habitual.
- Scan families for chart patterns, market heat and your own playbooks
- Benchmark heat by sector at the session close
- Or skip the sectors and scan a list of your own symbols
The board
Candidates that explain themselves
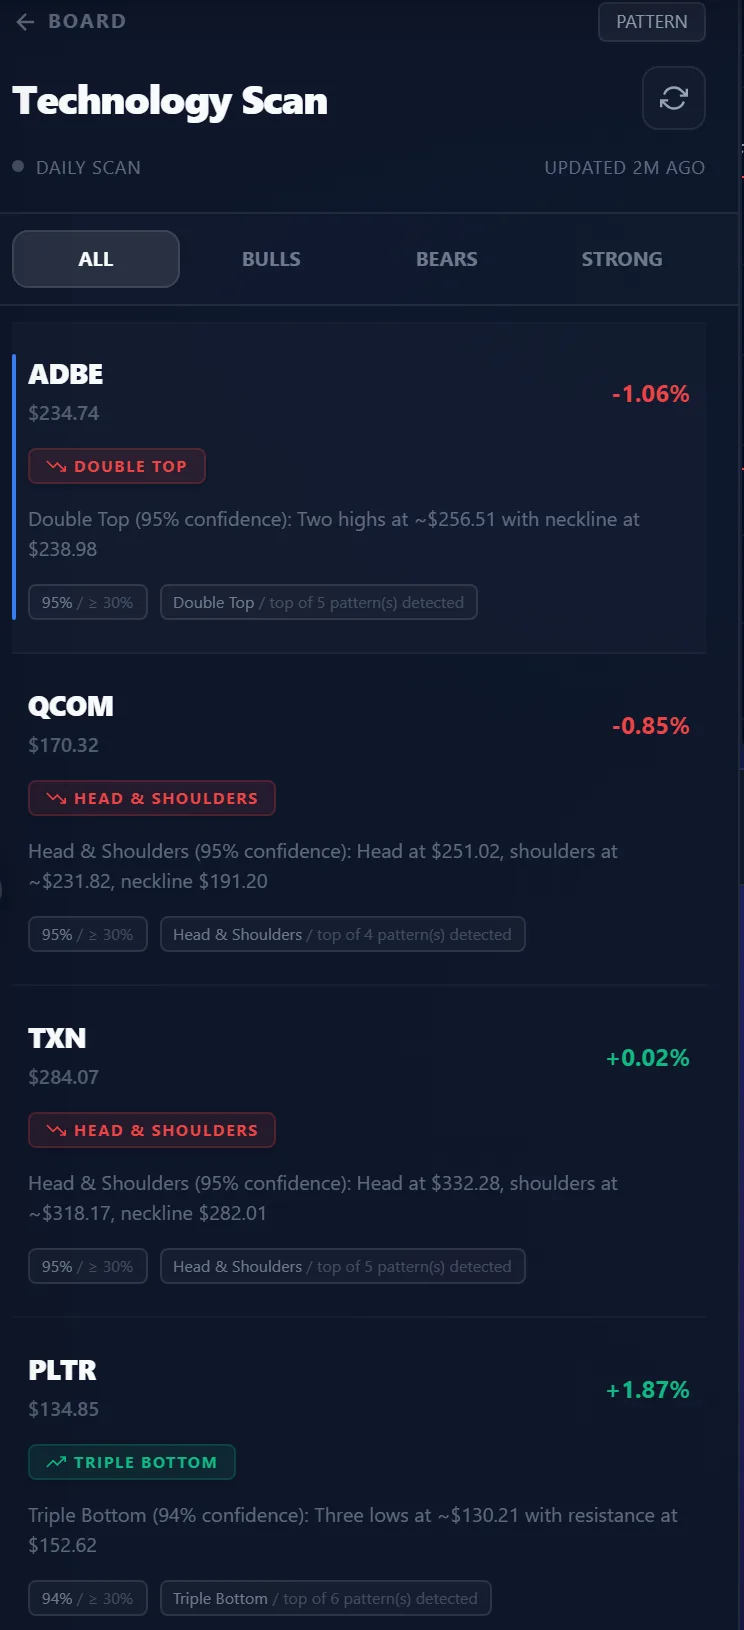
Every result states the pattern it matched and the levels behind it. A double top names its highs and its neckline, so you can disagree with it on the chart in front of you.
- Filter to bulls, bears, or only the strongest matches
- Each card names the pattern and the levels behind it
- Nothing here is a recommendation — Rapid Scan finds candidates, you make the call
Track record
How has this setup done before?
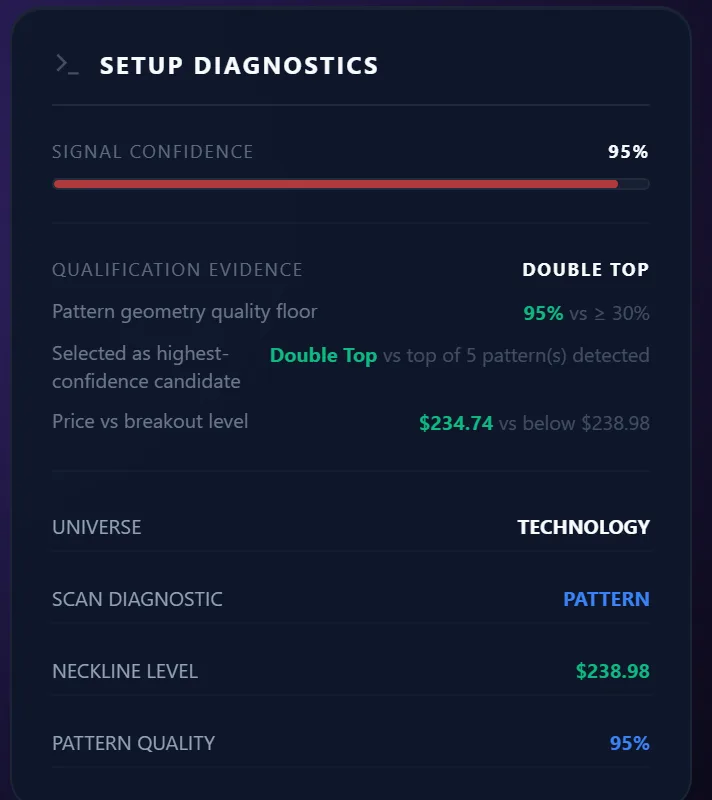
Select a candidate and the diagnostics show how that setup's past signals followed through: the share that moved in its direction over the next five sessions, how many signals that figure rests on, and a 95% Wilson interval around it. With fewer than ten signals, the setup is marked unproven rather than given a rate.
- Measured only on bars after each signal, never on the bar that produced it
- The sample size sits beside every rate
- It describes what past signals did, not the odds of your next trade
Speed
Hands stay on the keyboard
Move through candidates, filter, re-scan, watch a symbol or open its chart without reaching for the mouse. The point of a scanner is throughput, and tab management is where throughput goes to die.

Plan availability
Coming soon · Pro and Ultimate
Rapid Scan is not switched on yet. When it ships it will be included with Pro and Ultimate.
Compare plans