Analyse
Analytics
The at-a-glance view of how you actually trade.
Win rate, profit factor, expectancy, a daily P&L calendar, and an equity curve — computed from your imported trades, not your memory of them. Deep Analysis and Reports take the same data further: by setup, tag, time and hold, with the trades behind the numbers a click away.
Analytics / Product viewPlay to explore
01
KPIs that matter
Win rate, profit factor, expectancy, and average win/loss — the numbers that describe an edge, tracked over time.
02
Calendar and curve
A daily P&L calendar and equity growth curve show the shape of your months, not just the totals.
03
Customisable dashboard
Arrange the tiles around how you review — several dashboard tabs, three starter views, and tiles you drag and resize.
From imported trades to answers
- 01
Start from a view
Your dashboard starts from one of three ready-made views — Command Center, Review & Discipline or Performance Trends. Pick the one that matches how you review, and keep more than one as tabs.
- 02
Keep the tiles you use
Thirteen widgets are available, from the KPI gauges and Trade Health to the performance calendar and equity curve. Add the ones you want, drag them into place, resize them, and the arrangement is saved.
- 03
Go deeper when a number surprises you
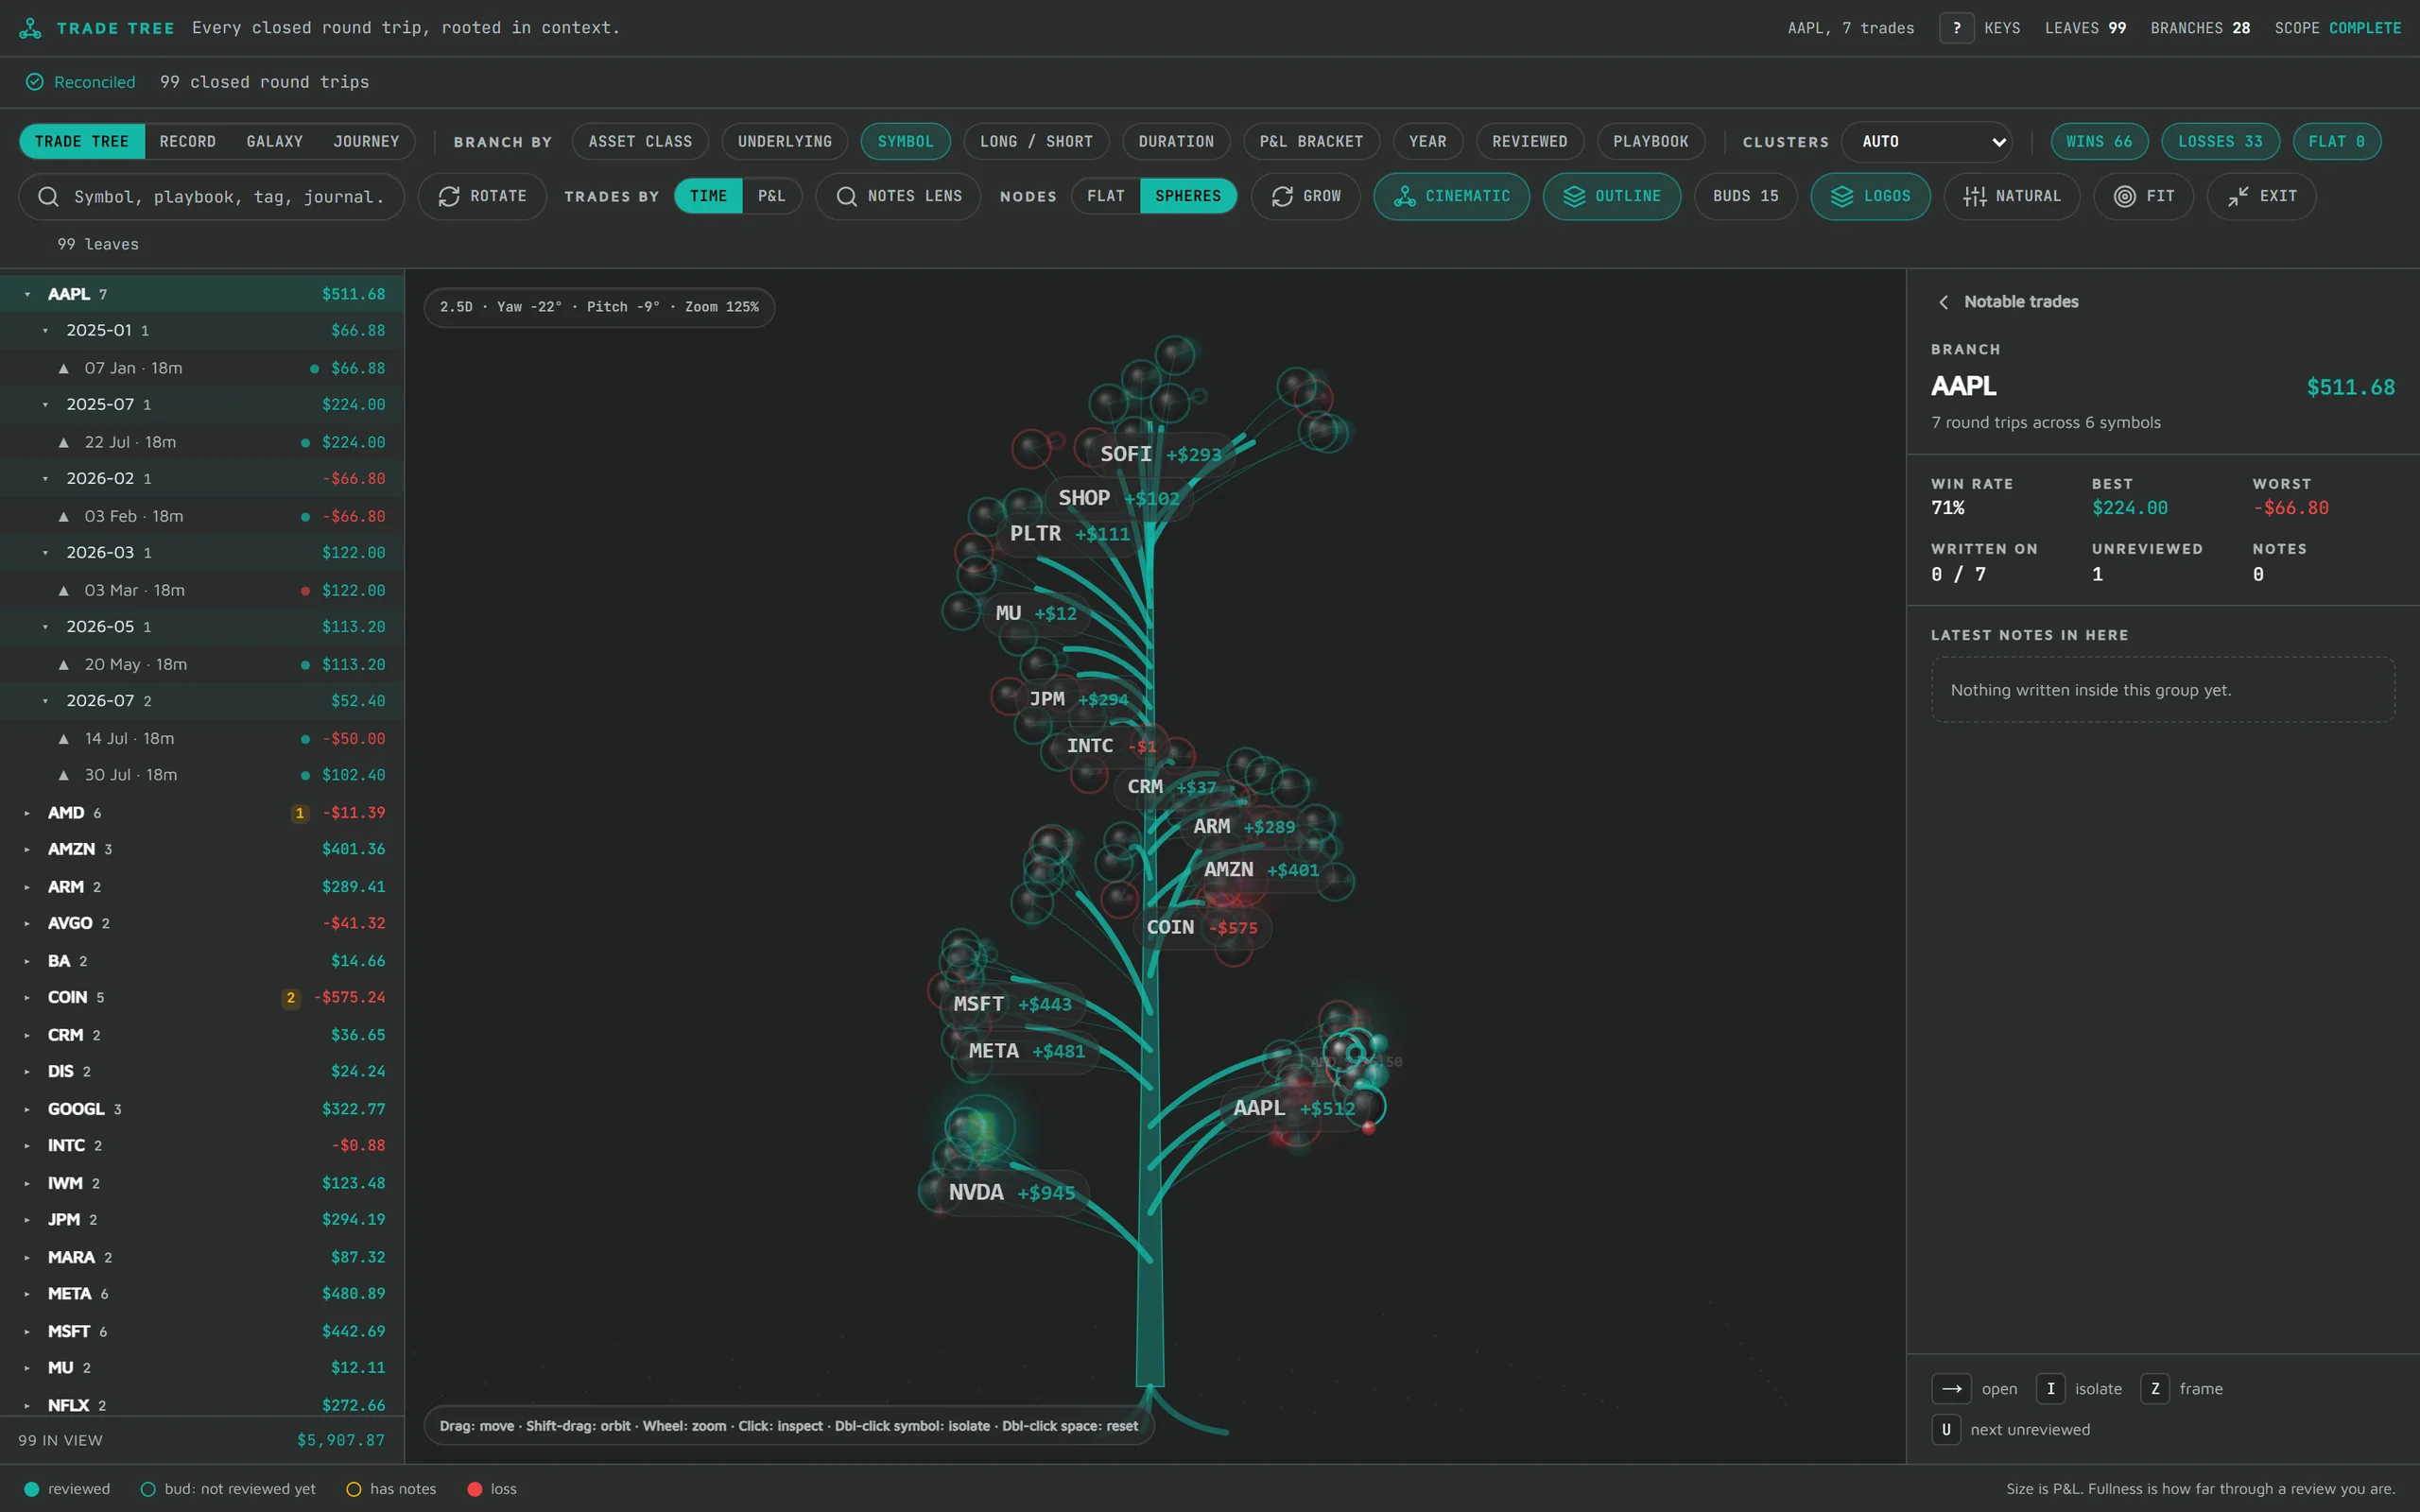
Deep Analysis takes the same trades further: five lenses, from a Trade Tree of every closed trade to a breakdown by symbol, asset class, playbook, time, hold, tag and tag category.
Ready-made, then yours
Three starter views, thirteen tiles to choose
The dashboard starts from a curated view rather than a blank grid, so a new account has a sensible layout on day one. In Edit Layout, switch between views, add or remove tiles, drag them into order and resize them from any corner; your arrangement is saved to your account.
- Command Center, Review & Discipline and Performance Trends, with more than one dashboard as tabs
- Thirteen widgets including Total P&L, Win Rate, Profit Factor, Expectancy, Equity Curve, Trade Health and the Performance Calendar
- Reset back to a view whenever you want a clean slate
Deep Analysis
Five lenses on the same trades
Deep Analysis is the long-form view. The Trade Tree puts every closed trade on one picture you can walk with the keyboard, and you can grade a trade and write its notes right there. Findings, Breakdown, Options and Journal look at the same trades other ways, and a finding or a Breakdown row opens its trades back in the tree.
- Grade and annotate a trade in place, without leaving the tree
- Date, account and symbol filters narrow the tree, Breakdown, Options and Journal
- Risk metrics beside Breakdown: Sharpe, Sortino, profit factor, max drawdown
Reports
The questions you ask every month
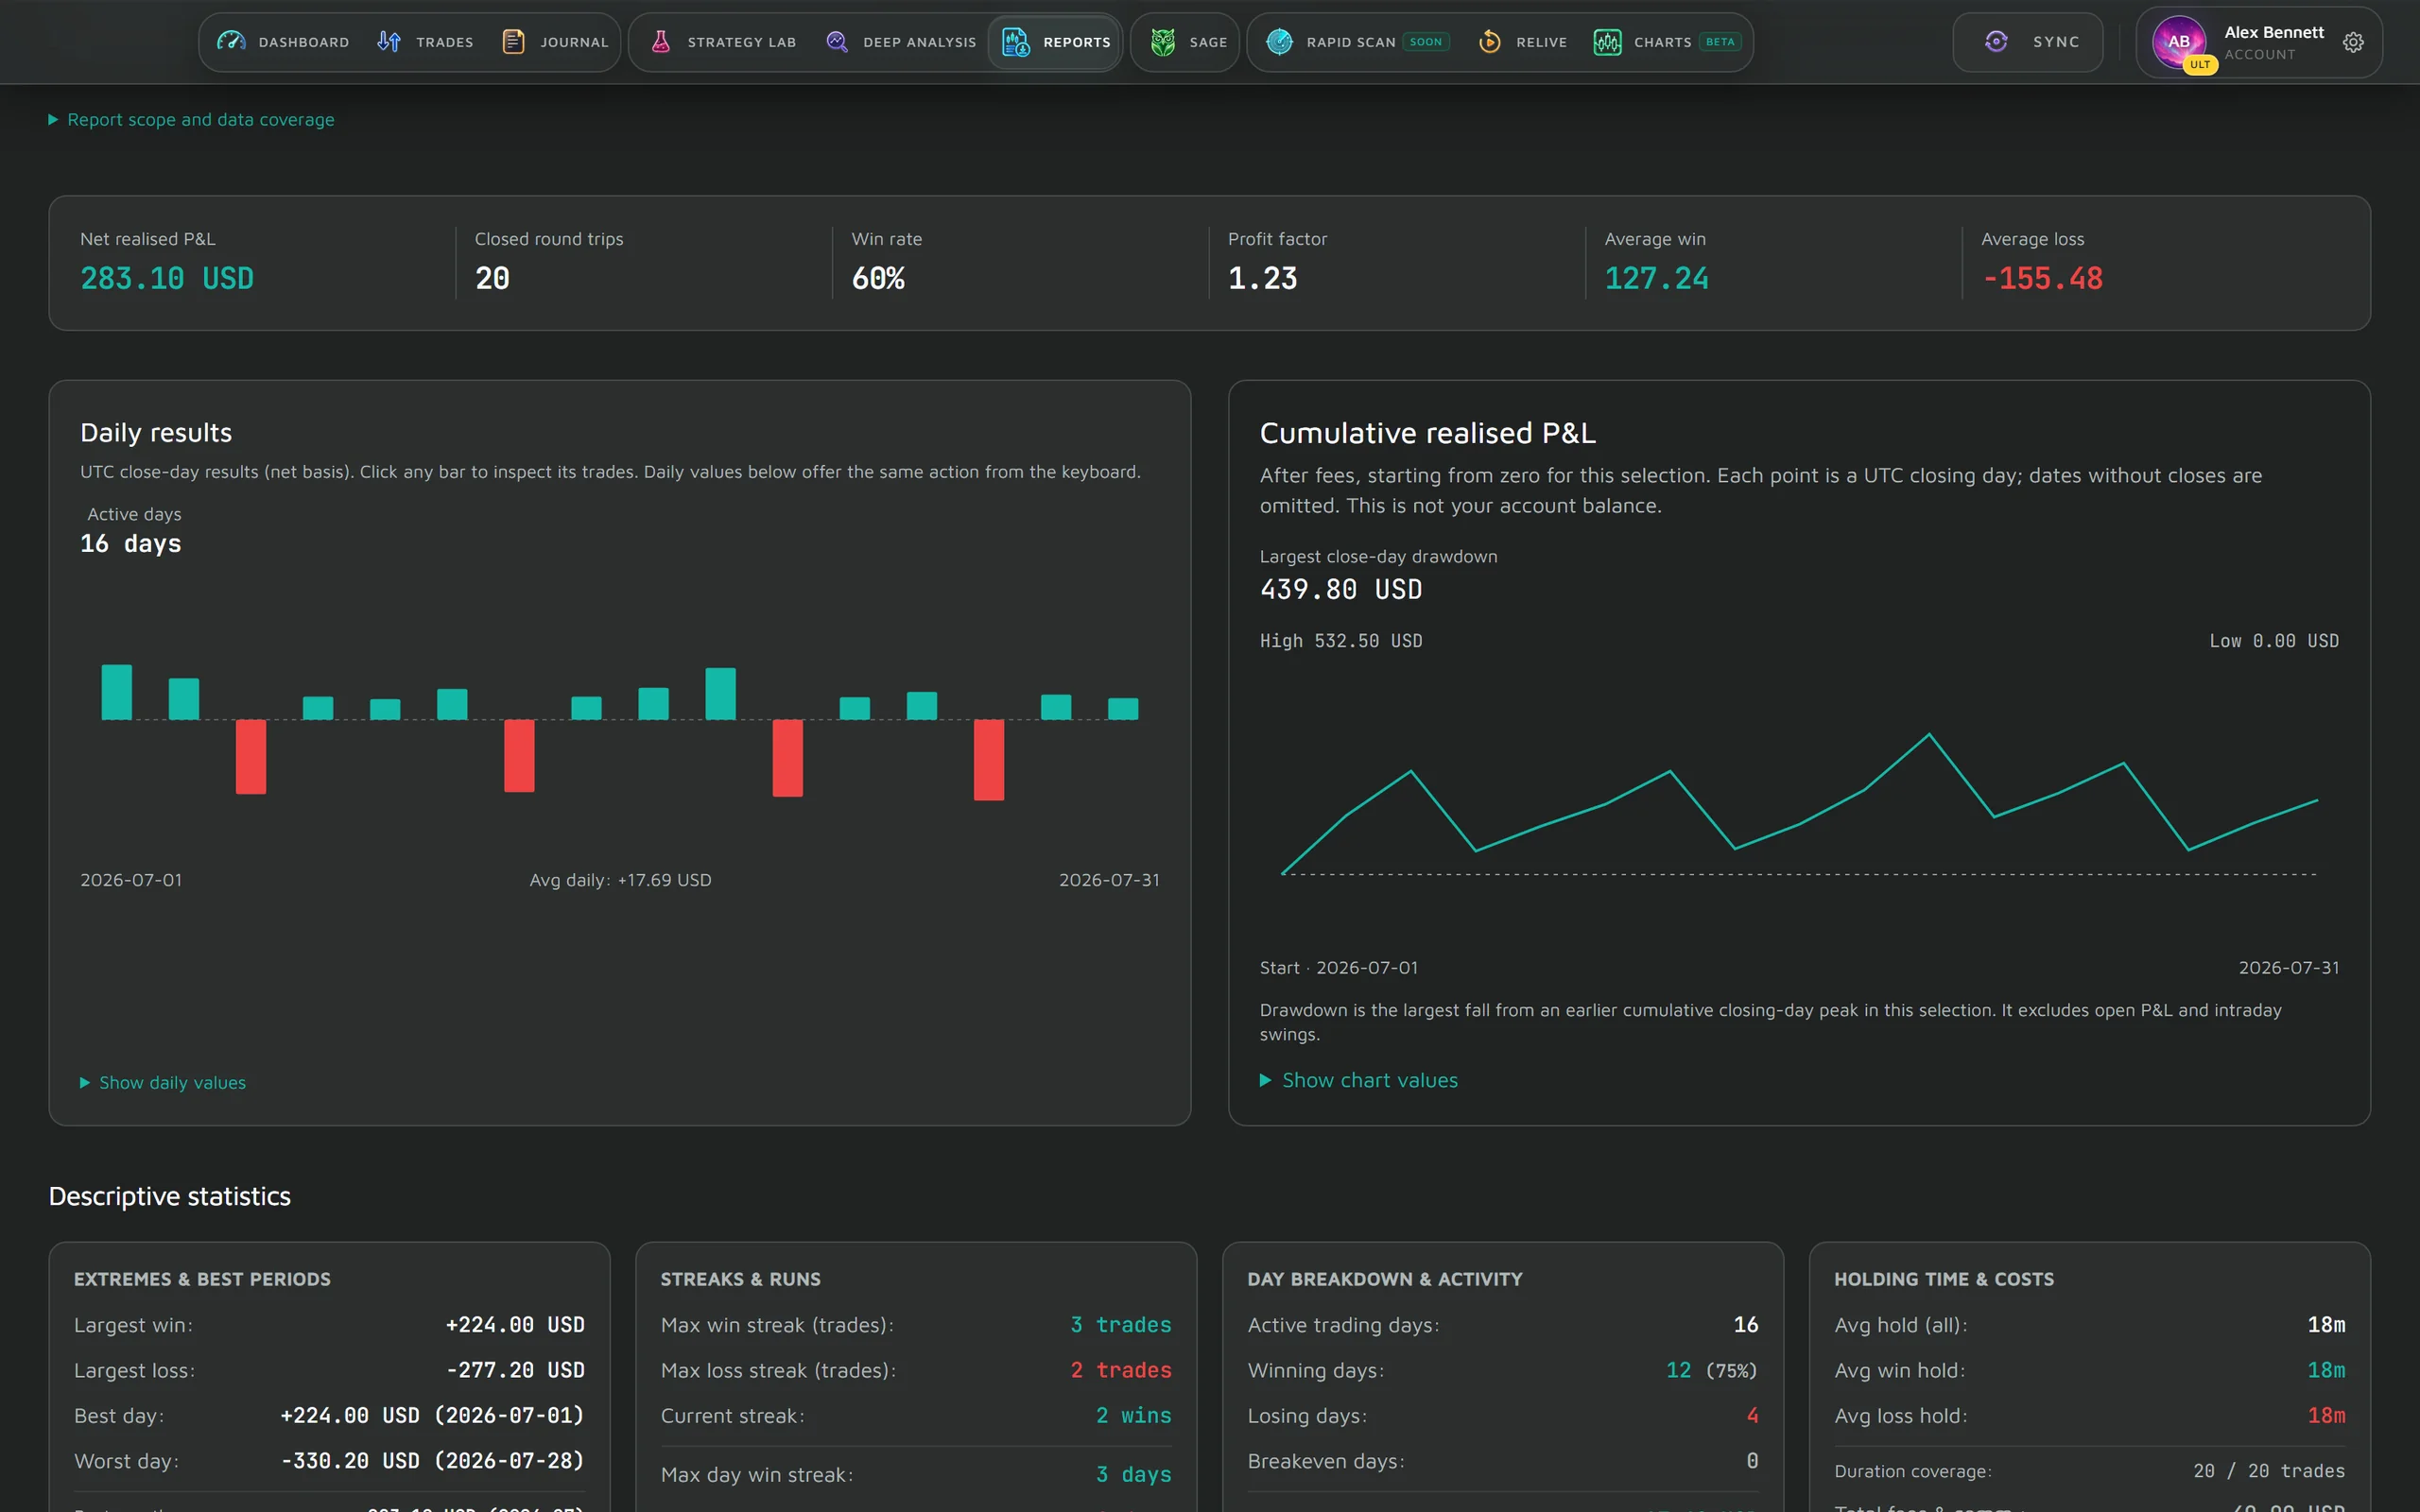
Reports answer the standing questions: how a month went, where your results are concentrated, and how two periods or groups compare. Group by day, month, weekday, entry time, holding time, symbol, asset class, setup, tag or tag category, save the views you check regularly, and take the numbers with you.
- Overview, Breakdowns, Compare and Saved views
- Per-tag and per-category results, from the tags you put on your trades
- Download the trades or the report as CSV, or print it to PDF
Plan availability
Free, Pro and Ultimate
Available on every plan, including Free. The dashboard, its widgets and views, Deep Analysis and Reports are on every plan, and the free plan holds unlimited trades.
Compare plans